If you’re a follower of GSWA’s print newsletter, Across the Watershed, you may recall that in our Spring-Summer 2015 issue on page 11, I wrote about our forthcoming Great Swamp Watershed Report Card, which would grade our streams based on our stream monitoring data. After many hours by GSWA staff and volunteers, the numbers have been crunched and the results are in for 2014, including some surprises!
The results are laid out in an easy-to-interpret information, seen here:
As you can see, there are some areas where our streams are clearly very healthy. There were no issues with pH in any of our streams, and Primrose Brook remains the healthiest stream in the Great Swamp watershed. Water clarity is also quite good, as is water temperature in most streams.
By looking at all the data together, we are also able to see what the issues are and how they are interrelated. Let’s start with bacteria: results show very poor E. coli results in most streams. This is primarily because E. coli levels in many of our streams increase during and immediately after a rainstorm. So the primary problem here is stormwater runoff, which carries E. coli from land into our streams during rain storms. (To learn more about this relationship, check out this past blog post.)
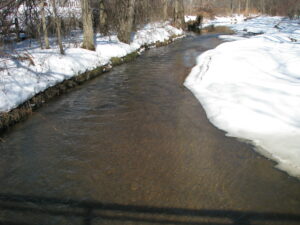

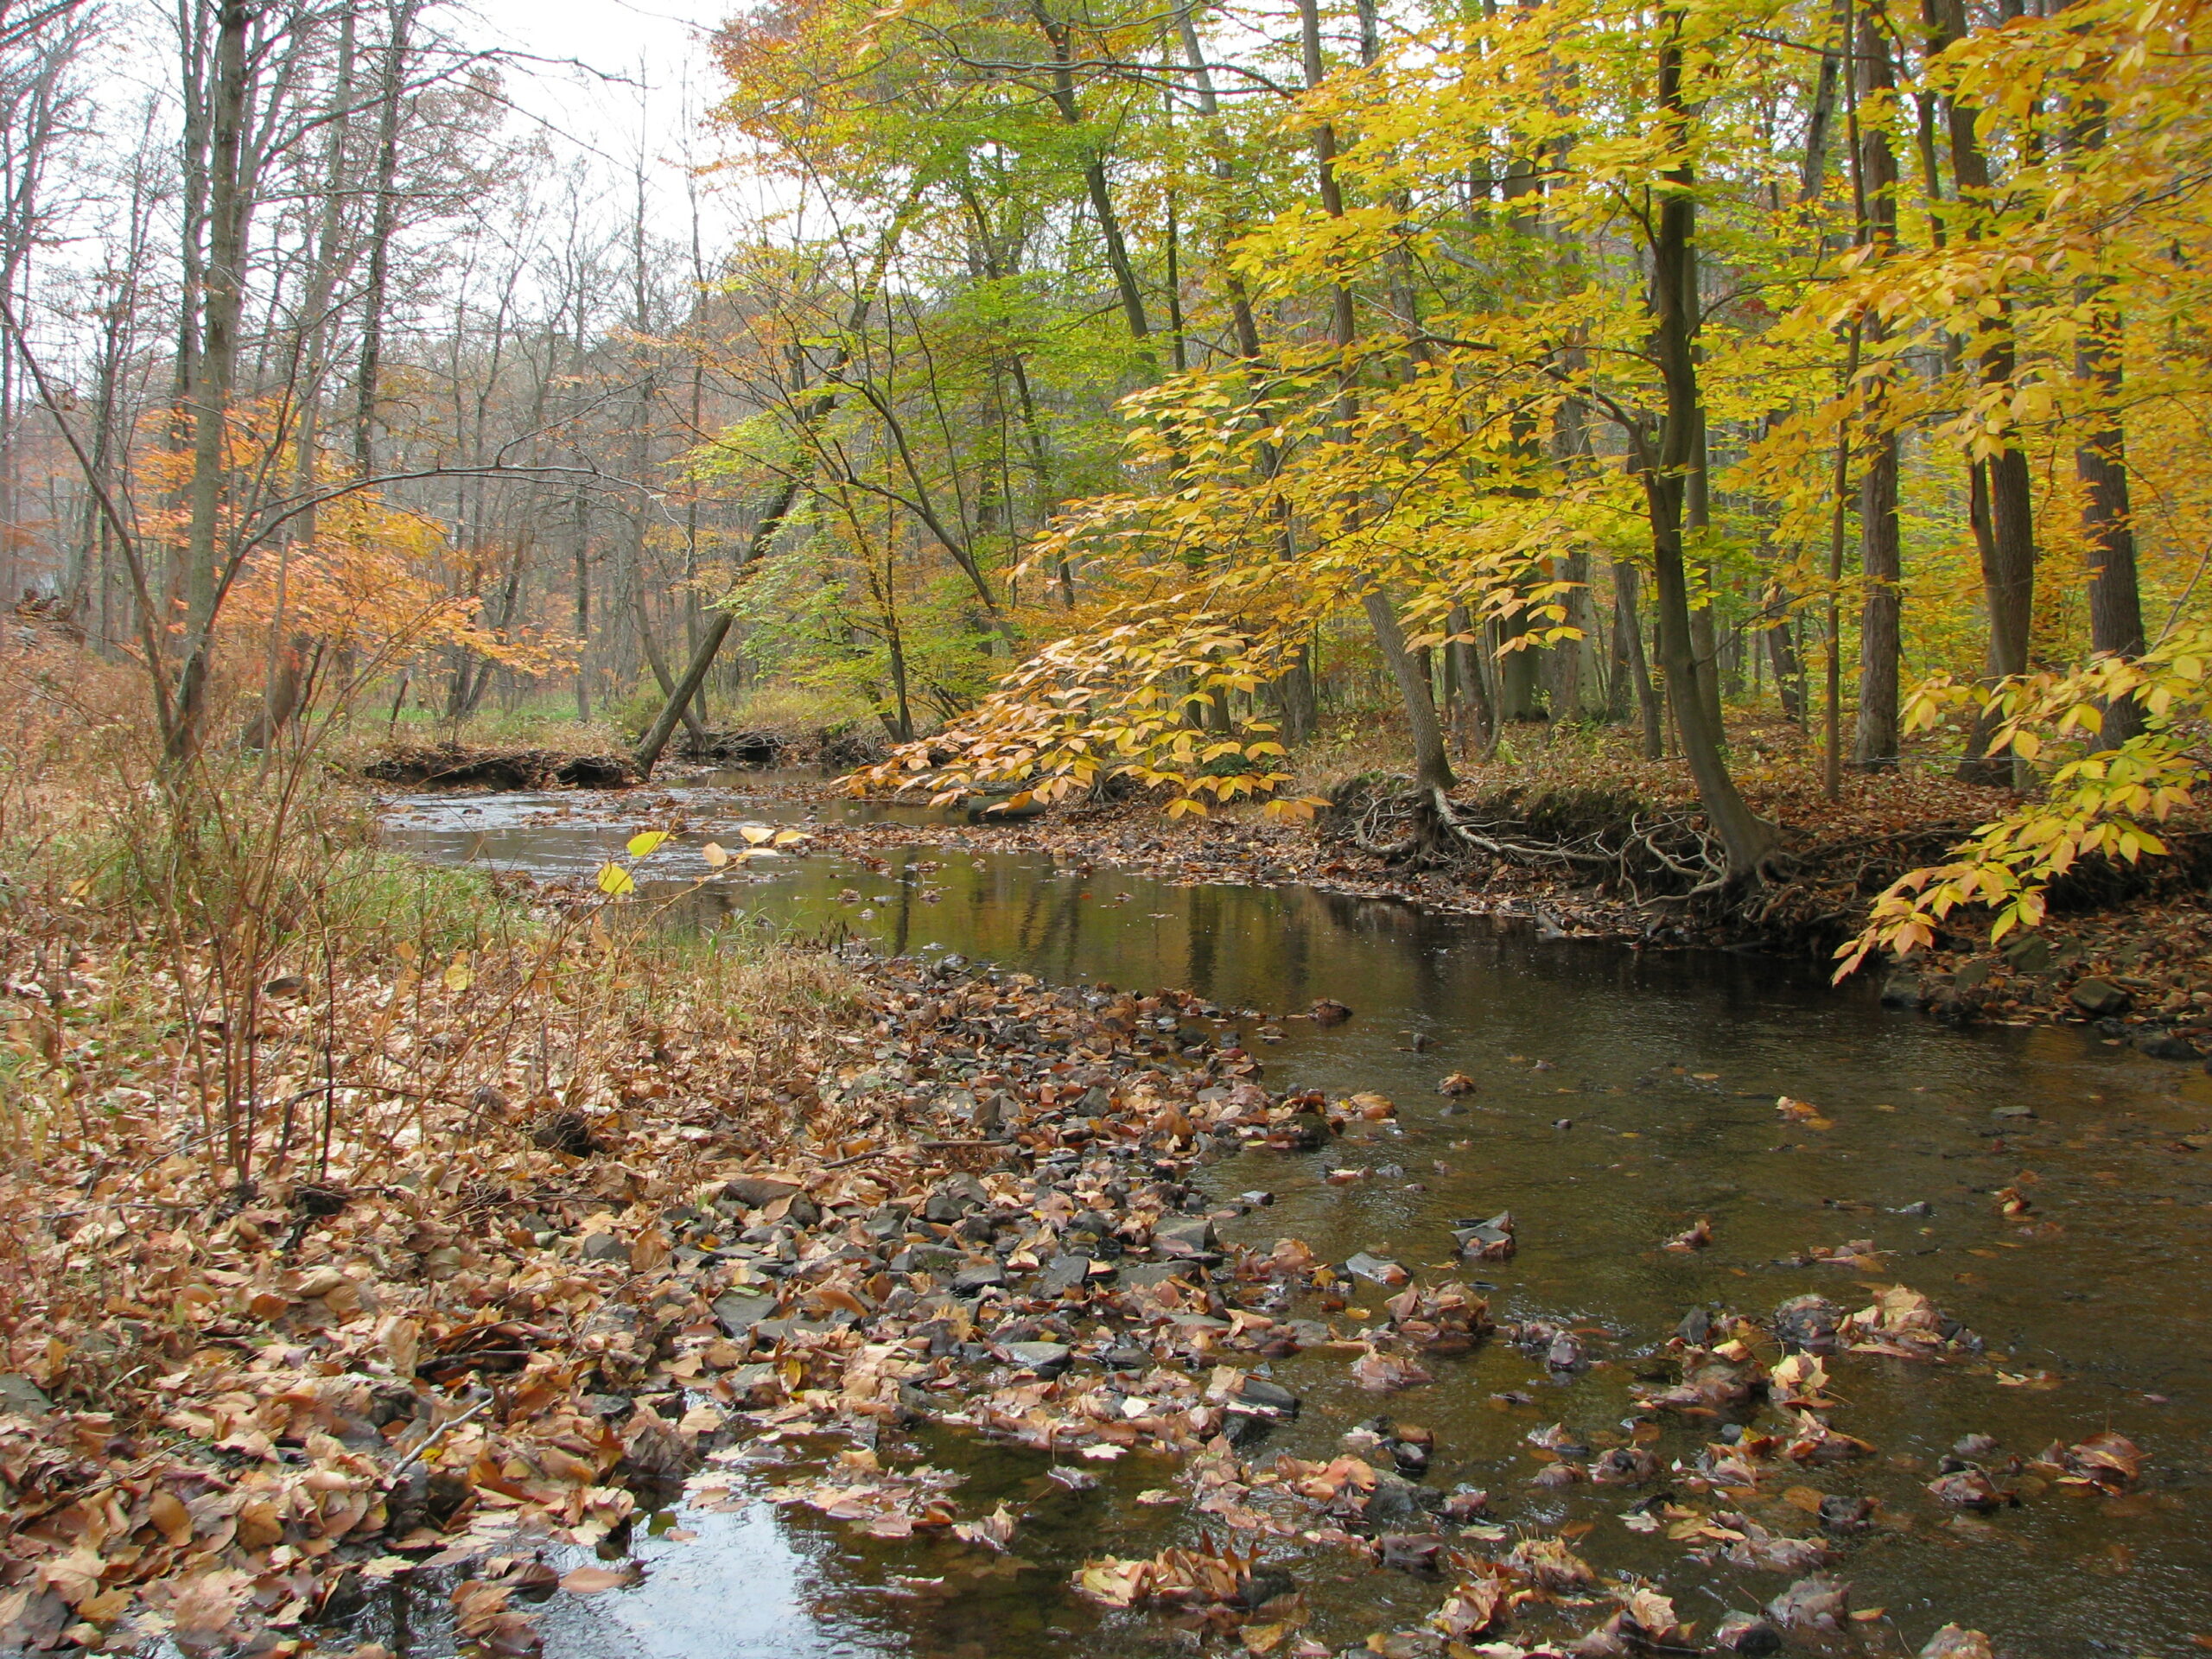
Great Brook Stream, May 2014
Another issue of concern that the Report Card analysis brought to my attention is sediment. This is the first time that data collected during visual stream assessments was included in analysis, and it revealed that many of our monitoring sites on all five major Watershed streams have some form of streambank erosion and/or fine sediment in the stream. Excess sediment can reduce water clarity, which we noted during a rain event monitored in 2014. Poor water clarity can negatively impact all aquatic life, even aquatic plants that rely on good water clarity for sunlight. Additionally, when sediment settles out of the water onto the bottom, it can bury habitat needed by fish and macroinvertebrates.
To learn more about the findings of the 2014 Great Swamp Watershed Report Card, and recommendations for how we can all help improve our local streams, visit our website! You can view the Great Swamp Watershed Report Card and a presentation about the findings. If you’d like to learn more about how exactly we created the report card, check back soon — we’ll post the 2014 stream monitoring data and information about the analysis methods shortly.
